Accessing Analytics
Navigate to your bot and click theResults tab, then select the Analytics tab to view detailed
performance metrics and visual flow analysis.
Analytics features require a paid plan. Users on free plans can view basic submission data but
need to upgrade to access the full analytics dashboard.
Analytics Overview
Key Metrics Panel
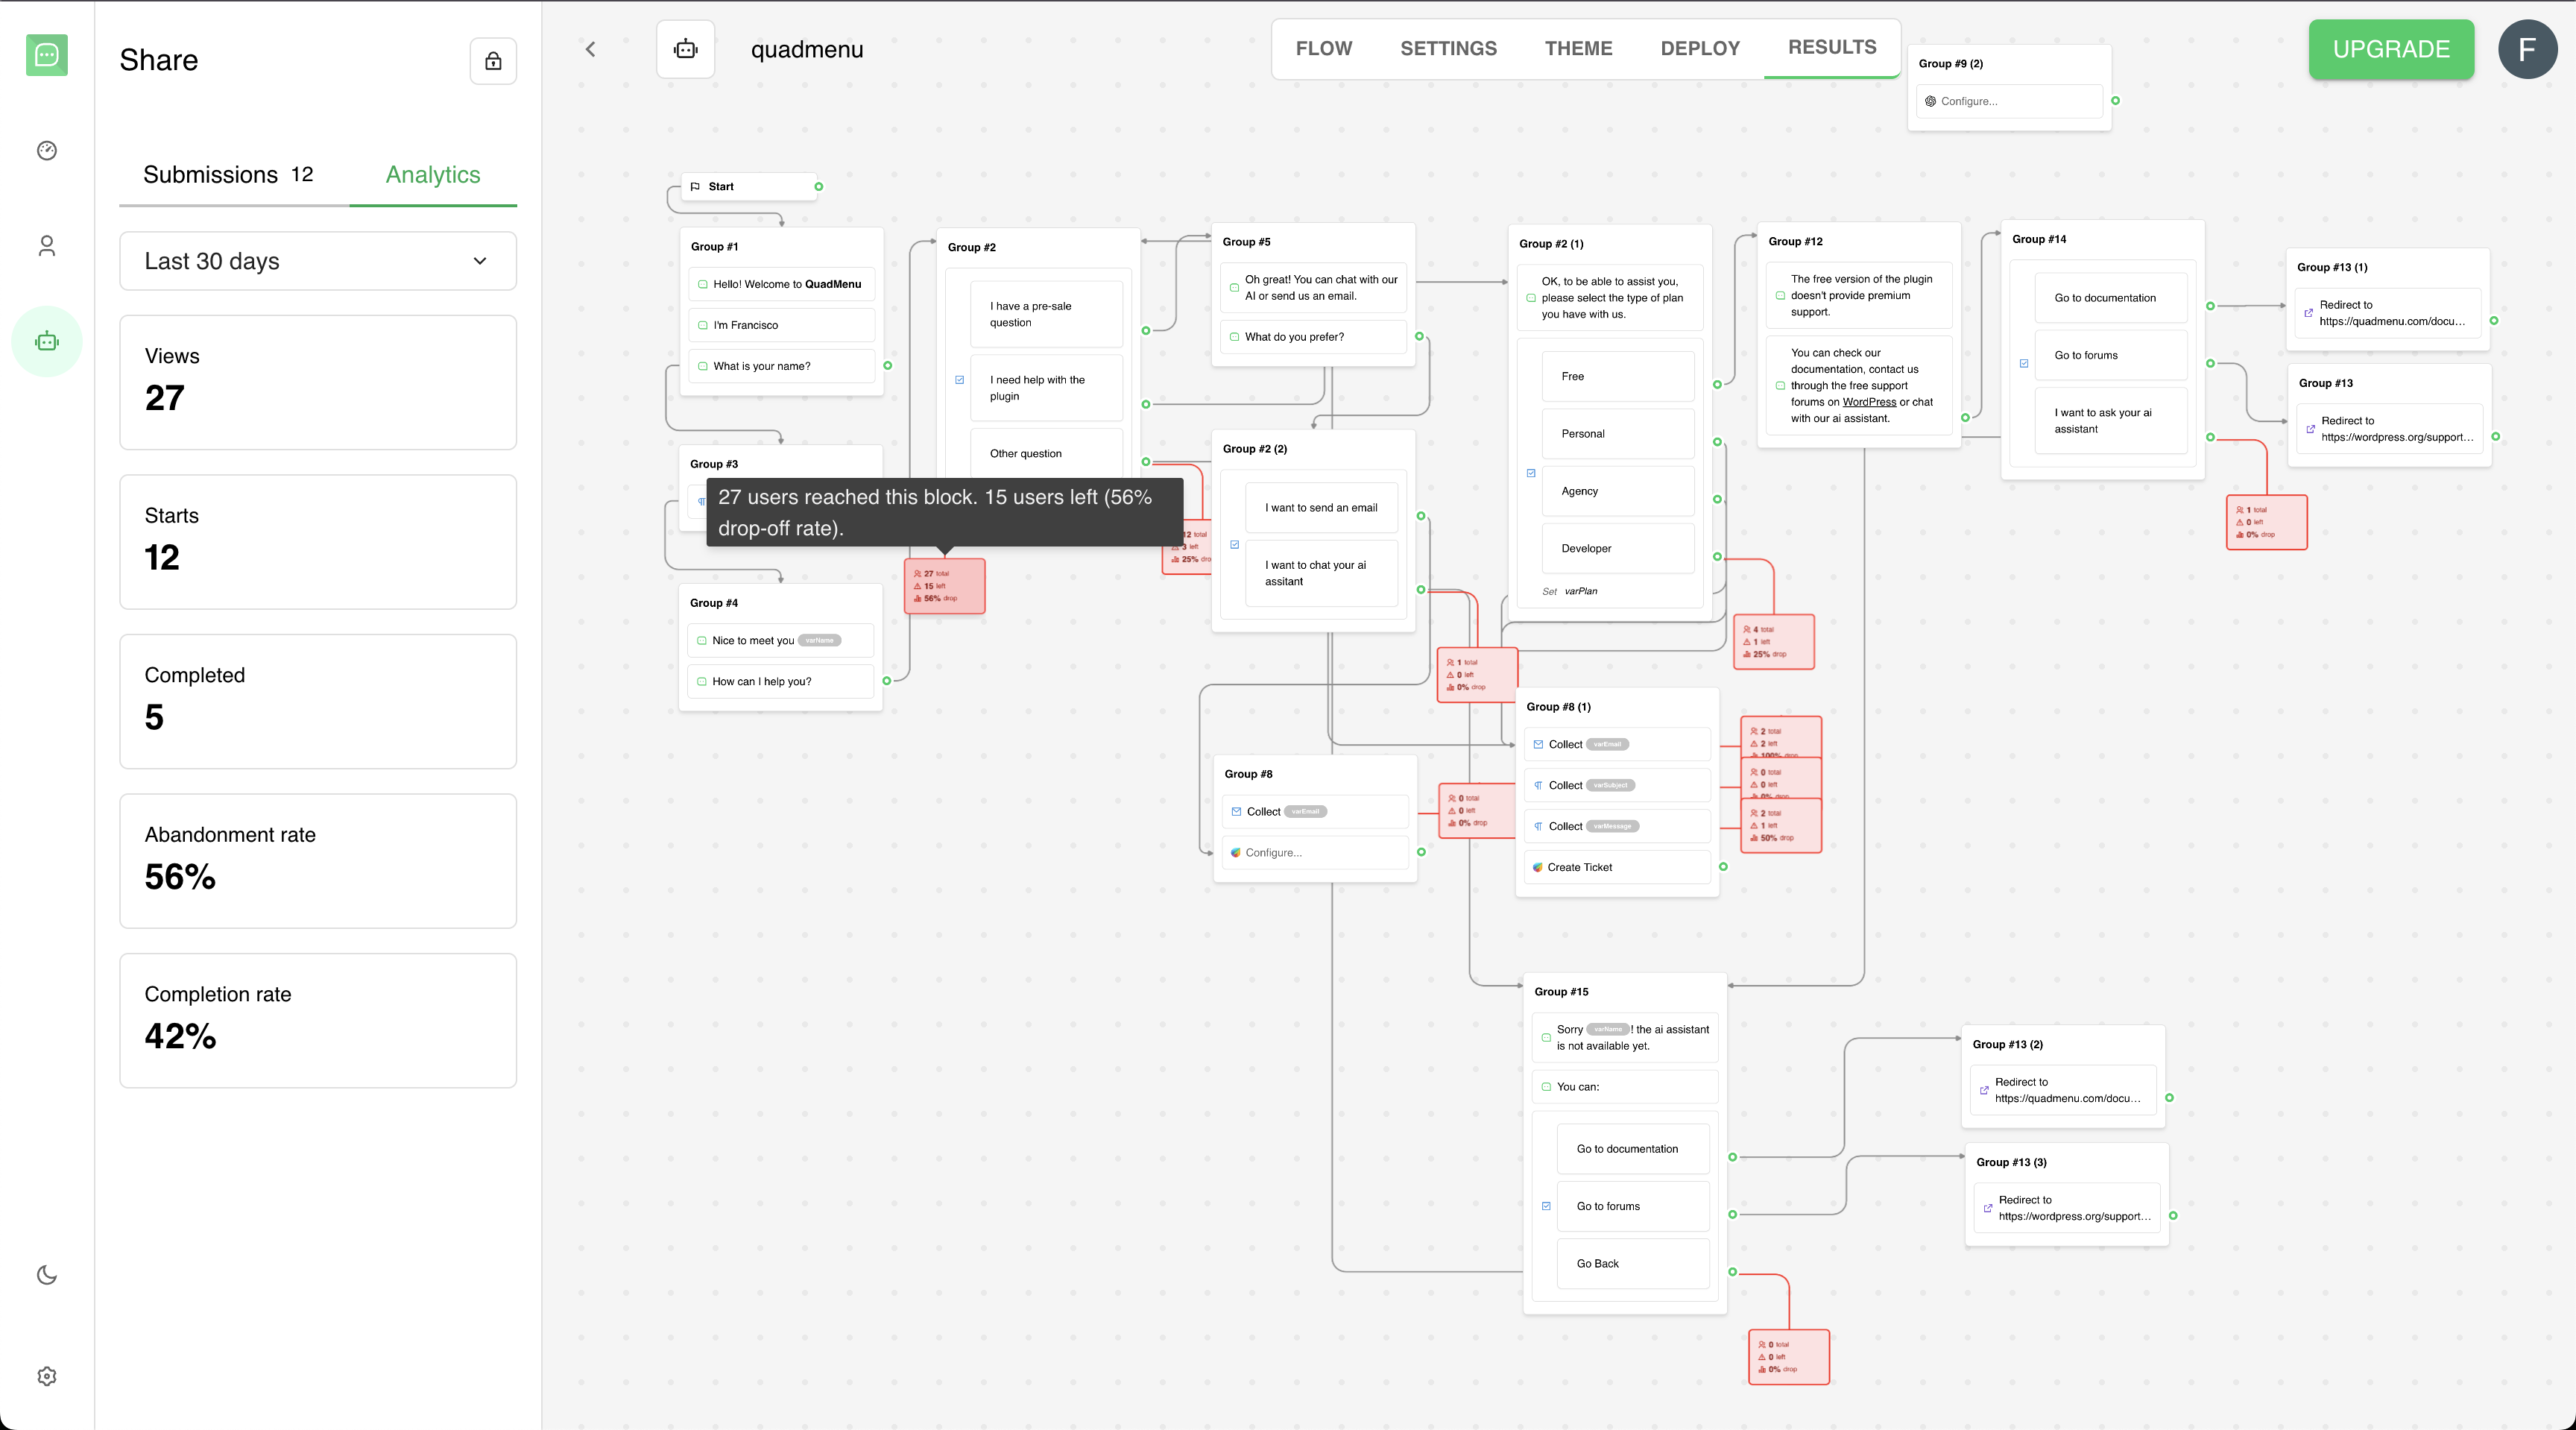
The analytics sidebar displays essential performance indicators: Views Total number of users who loaded your bot, including those who never started interacting. Starts Number of users who began interacting with your bot by providing their first response. Completed Users who reached the end of your bot conversation flow. Abandonment Rate Percentage of users who viewed your bot but never started:(Views - Starts) / Views × 100
Completion Rate Percentage of users who completed the bot after starting:
Completed / Starts × 100
Time Filtering
Use the time filter dropdown to analyze data for specific periods:- Today: Current day’s data
- Last 7 days: Previous week’s performance
- Last 30 days: Monthly view (default)
- Month to date: Current month from day 1
- Last month: Complete previous month
- Year to date: Current year from January 1
- All time: Complete historical data
Visual Flow Analytics
Interactive Flow Diagram
The main analytics view shows your bot’s flow with real-time user data overlaid on each block and connection: Block Statistics- Each block displays the number of users who reached that point
- Input blocks show response counts
- Drop-off visualization highlights where users abandon the conversation
- Arrows between blocks show user flow quantities
- Thicker lines indicate higher user traffic
- Multiple paths show how users navigate through your bot
- Default path: The primary flow you designed
- Off-default paths: Alternative routes users take based on their responses
- Branch analysis: Compare performance of different conversation branches
User Journey Insights
Drop-off Points Easily identify where users most commonly abandon your bot by comparing user numbers between consecutive blocks. Conversion Funnels Track user progression through your bot’s stages to identify bottlenecks in your conversion process. Popular Paths See which conversation branches are most frequently taken by users.Data Collection and Processing
Real-time Data
Analytics data updates in real-time as users interact with your published bot. Metrics refresh every few minutes to provide current insights.Answer Tracking
The system tracks:- Unique users per user block (avoiding duplicate counting)
- Response completion rates
- Time-based filtering with timezone support
- Both current and historical bot versions
Edge Visits
Analytics monitor:- Default conversation paths
- Alternative routes triggered by user responses
- Branch-specific performance metrics
- Conditional logic outcomes
Using Analytics for Optimization
Identifying Problems
High Abandonment Rate If many users view but don’t start your bot:- Review your opening message clarity
- Check if the initial question is too complex
- Consider simplifying the first interaction
- Simplify complex questions
- Reduce the number of required fields
- Add progress indicators for long forms
- Shorten the conversation flow
- Make the value proposition clearer early on
- Remove unnecessary steps
A/B Testing Opportunities
Use analytics to:- Compare performance before and after changes
- Test different conversation flows
- Evaluate the impact of new blocks or modifications
- Measure improvement over different time periods
Performance Benchmarking
Track metrics over time to:- Monitor the impact of bot improvements
- Identify seasonal trends in user behavior
- Set performance goals and KPIs
- Measure ROI of bot optimizations
Billing Integration
Plan Requirements
Analytics access is tied to your workspace billing plan:- Free plans: Basic submission counts only
- Paid plans: Full analytics dashboard with visual flow analysis
- Upgrade prompts appear for users on free plans
Usage Considerations
Analytics data collection doesn’t count against your bot response limits but may be subject to plan-specific features and retention periods.Technical Details
Data Accuracy
Analytics provide:- Precise user counting with duplicate result filtering
- Timezone-aware date filtering
- Separation of answer versions for accurate historical comparison
- Real-time updates with caching for performance
Privacy and Data
User data in analytics is:- Aggregated and anonymized for privacy
- Processed in compliance with data protection regulations
- Retained according to your plan’s data retention policy
Troubleshooting
Missing Analytics Data
If analytics don’t show expected data:- Verify your bot is published (analytics only track published bots)
- Check the selected time filter range
- Ensure users have actually interacted with your bot
- Confirm your plan includes analytics access
Discrepancies in Numbers
Number differences between views/starts/completed can indicate:- Users loading but not interacting (high views, low starts)
- Mid-conversation abandonment (high starts, low completion)
- Technical issues preventing completion
Results Table
View and manage detailed user submission data
Export Results
Export your bot data and analytics for external analysis